Trading Gaps Analysis

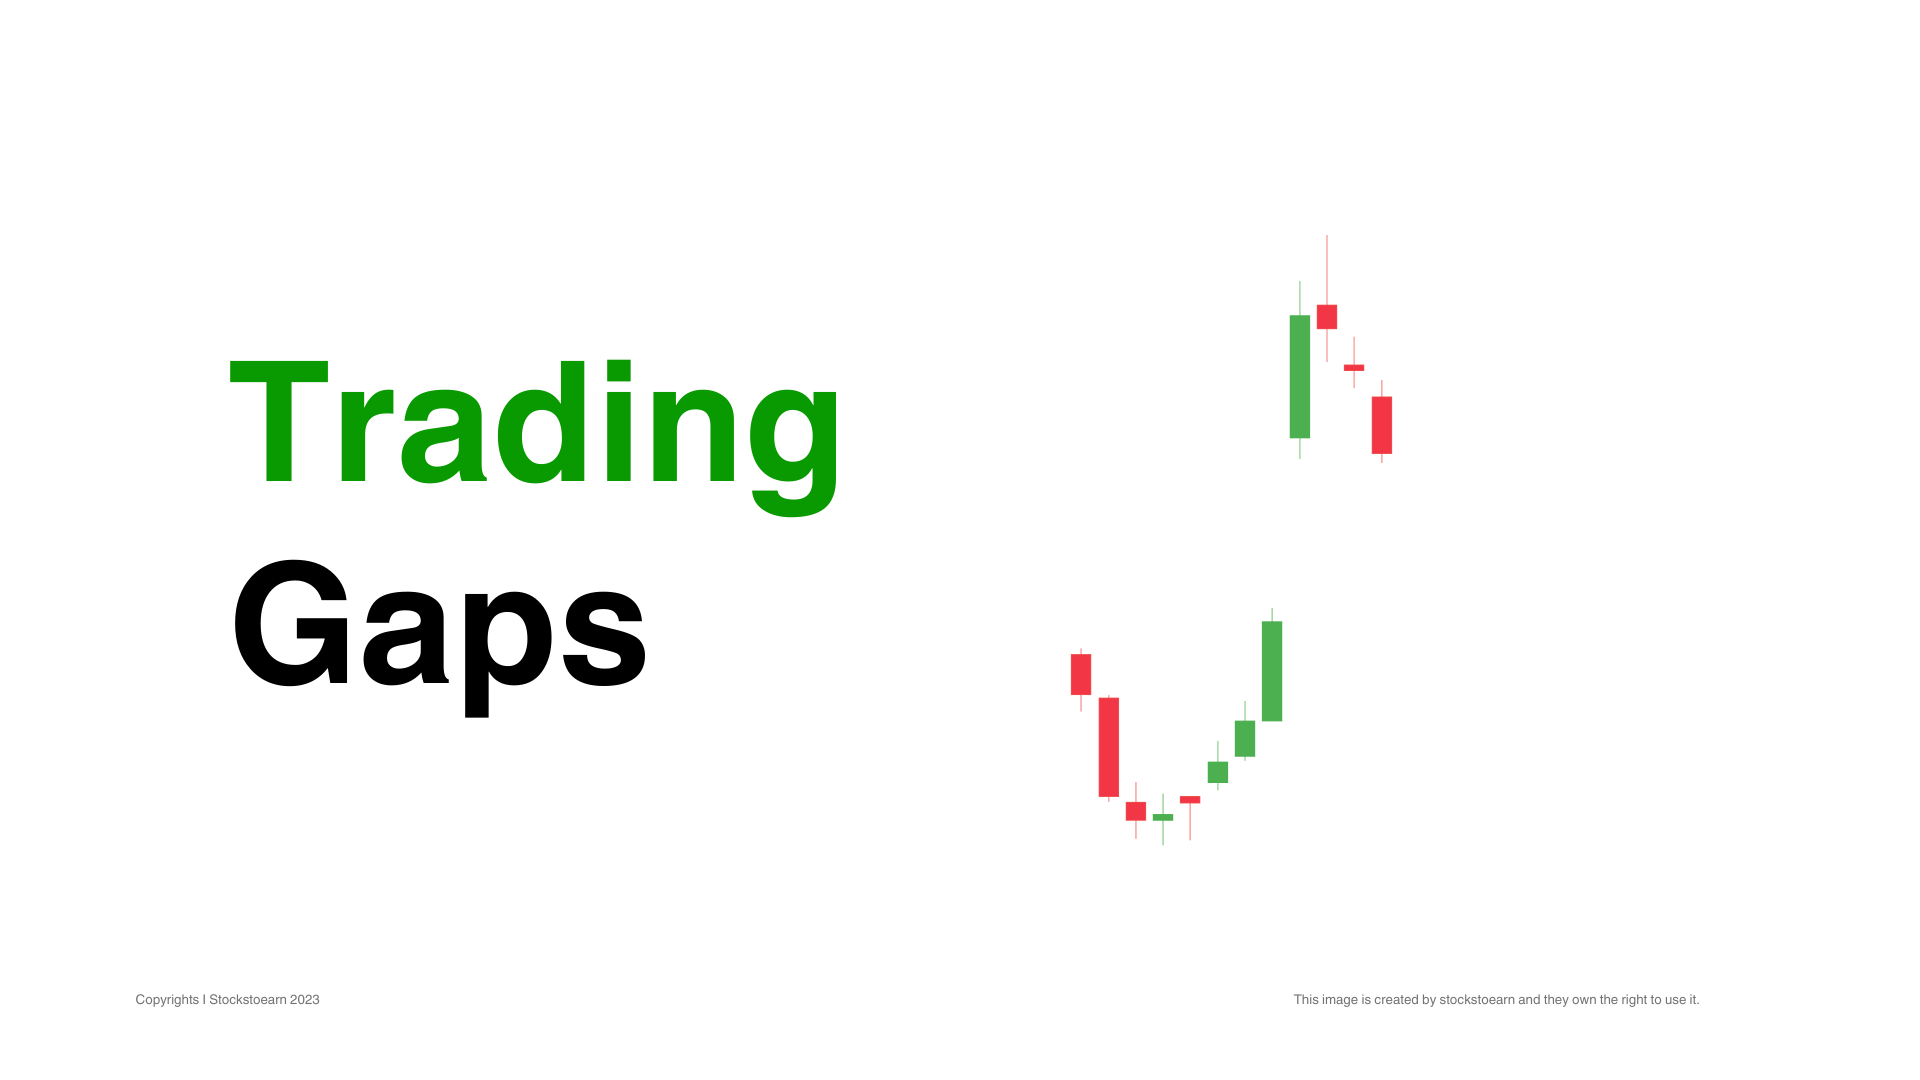
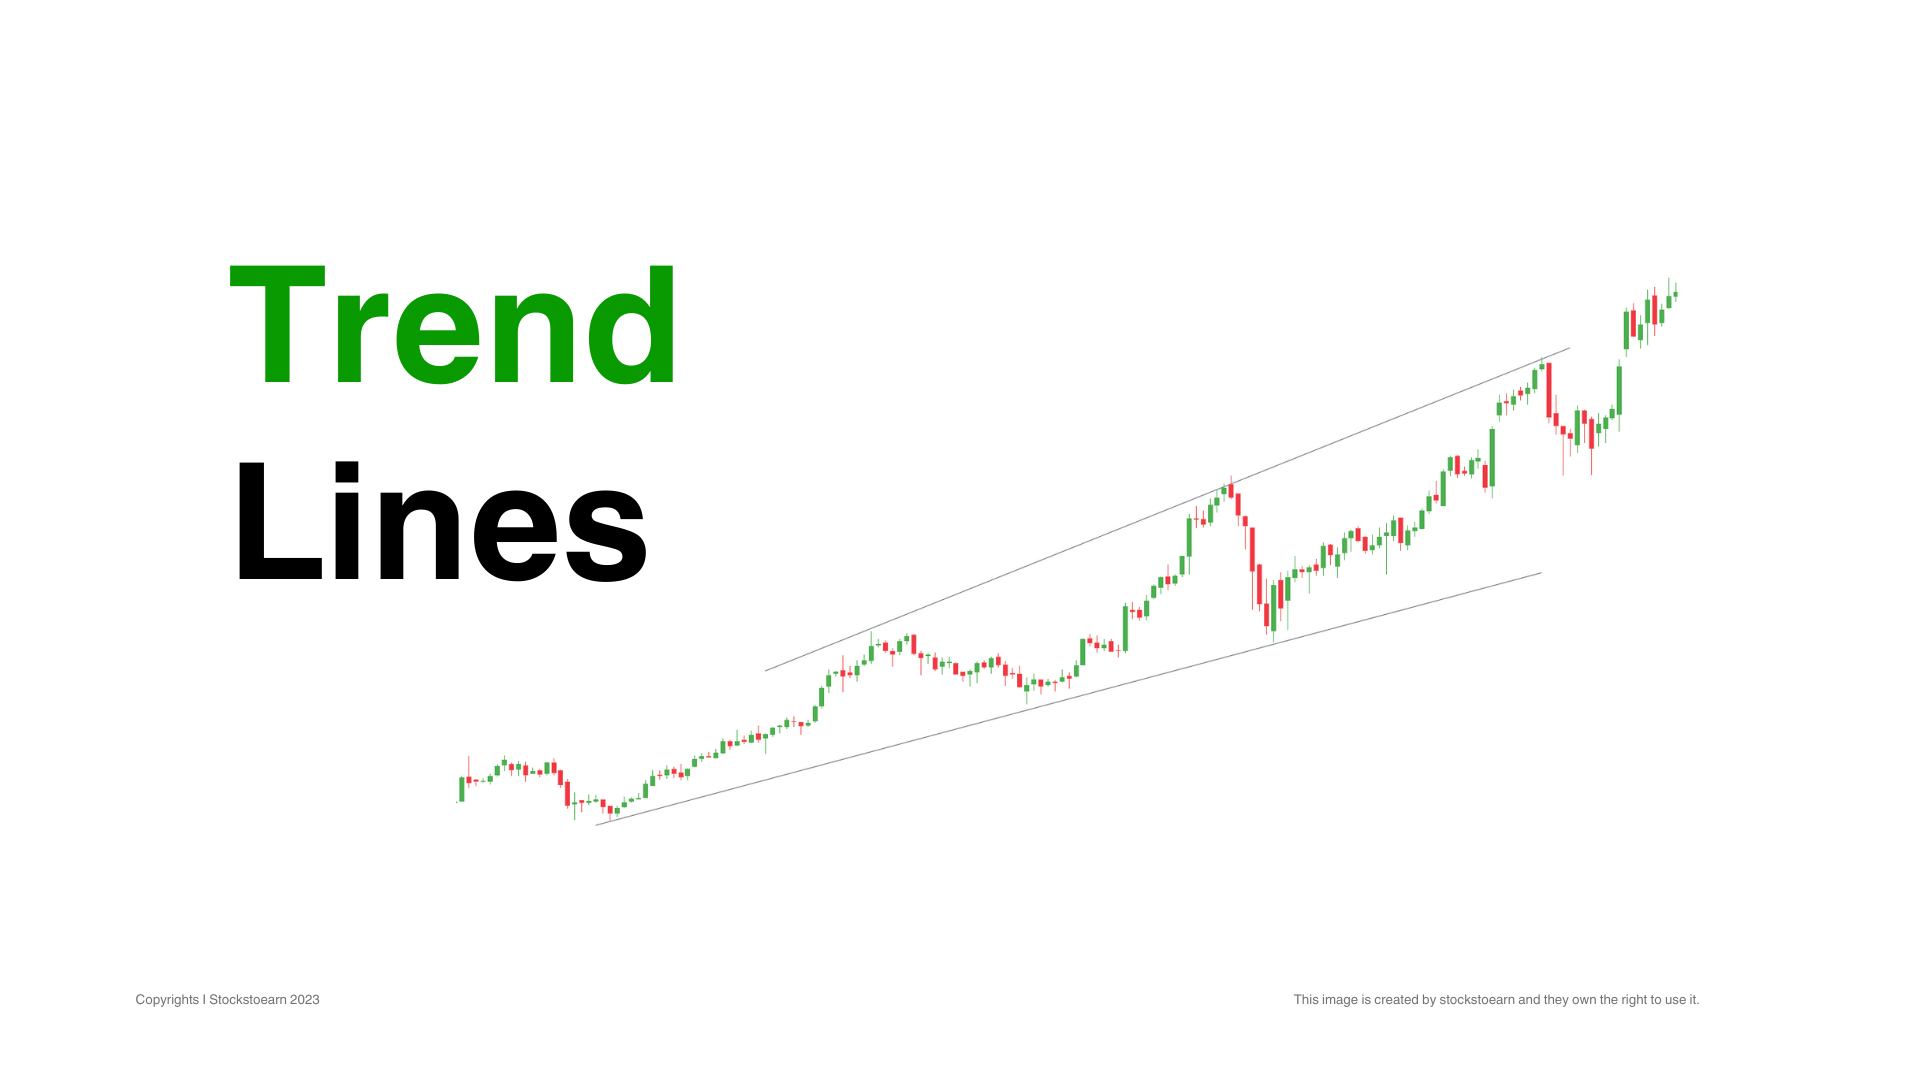
Trading Trading Gaps Trading Series I Education Hub Price charts often have blank spaces known as gaps. They represent times when no shares were traded within a particular price range. Gaps result from extraordinary buying or selling interest developing when the market is closed. When the market opens, the price is raised or lowered enough to satisfy all of the buying or selling orders. Learning Tip Trading Gaps happen quite frequently in the stock market. These gaps can significantly affect the stock price and its movements. So, it is quite crucial to learn them. Understanding Trading Gaps For an up gap to form, the low price after market close on the day of the up gap must be higher than the high price of the previous day. Up gaps are generally considered bull. A down gap is just the opposite of an up gap; the high price of the down gap day after market close must be lower than the low price of the previous day. Down gaps are usually considered bearish. A price chart with gaps almost every day is typical for very lightly traded securities and should be avoided. Prices often gap up or down at market open and then close the gap before market close. Such temporary intraday gaps should not be considered as having anything more significance than normal market volatility. Many investors mistakenly believe that gaps influence future prices to the point of eventually filling the gap. Instances where gaps close within a few days of forming can be significant. However, gaps have little to no influence on price action weeks or months after forming. Classification Types of Trading Gaps Breakaway gaps signal a change in market psychology about the future prospect of a security, especially when accompanied by above average volume. A bullish breakaway gap forms when a security gaps up after an extended decline, extended base or a consolidation period. A bearish breakaway gap forms when a security gaps down after an extended advance, an extended top or a consolidation period. Common gaps occur within a trading range or shortly after a sharp move as a reaction. These gaps do not reflect a change in market psychology, but rather represent price volatility or temporary imbalance of supply and demand. For instance, if a security has declined 20% in a week and gaps up, it would be considered a common gap and not likely to signify a change in trend.  Continuation gaps form near the middle of a short or intermediate trend in the same direction. These gaps signal a continuation of the preceding trend. Continuation gaps are also known as measuring or runaway gaps. These gaps can be triggered by news events that bring more market attention to a security. Exhaustion gaps occur in the direction of extended trends. For an exhaustion gap to be considered valid, prices should reverse soon after the gap and close the gap. In the later stages of a trend, the extent of the trend becomes widely reported; eventually causing a surge in trading that cannot be sustained. These events often mark the end of the trend. Conclusion Important Points Price gaps can be crucial indicators of shifts in trading activity. Gaps provide valuable insights into market sentiment and potential trading opportunities.  Recognizing and understanding the different types of gaps can be an invaluable asset for traders at all levels. Each type signifies different market conditions, with implications for strategy and risk management. Get PRO Get access to exclusive premium features and benefits. Subscribe a PRO plan. See More Related Topics Trading Chart Patterns Using Volume for Trading Load More

Trading Gaps Analysis Read More »

Trading Trend Lines

Trading Trading Trend Lines Trading Series I Education Hub The psychology of fear and greed of market participants ultimately determines the direction of prices in a market. Prices rise with greed (demand) and fall with fear (supply). A price trend is simply a sustained directional price move. It can be thought of as a tilted support/resistance zone. Learning Tip A trend will continue as long as either fear or greed is in control of a market. Trends fade or change direction as the balance of fear and greed changes. The extent of fear and greed in a market can be seen by how quickly prices are trending down or up. Understanding Types of Trends As stated earlier, a trend is a sustained, directional price move. Rising peaks and troughs constitute an uptrend; falling peaks and troughs constitute a downtrend. A trading range is characterized by horizontal peaks and troughs. Trends are generally classified into major (longer than six months), intermediate (one to six months), or minor (less than a month).  Long term investors are most interested with identifying long-term trends where short-term investors are more interested in minor and intermediate trends.  Triangle patterns should have a similar volume pattern – decreasing volume while the triangle is forming with a sharp increase in volume once a breakout is achieved. Understanding Trend Lines A trend line is a straight line that connects two or more low or high price points and then extends into the future to act as a line of support or resistance. The first two points establish the trend line while additional points validate it. An uptrend line has a positive slope and is formed by connecting two or more low points. Uptrend lines act as support. As long as prices remain above the trend line, the uptrend is considered intact. A break below the uptrend line indicates that demand has weakened and a change in trend could be imminent. A downtrend line has a negative slope and is formed by connecting two or more high points. Downtrend lines act as resistance. As long as prices remain below the downtrend line, the downtrend is intact. A break above the downtrend line indicates that supply is decreasing and that a change of trend could be imminent. Trend line breaks should not be the final arbiter, but should serve merely as a warning that a change in trend may be imminent. By using trend line breaks for warnings, investors and traders can pay closer attention to other confirming signals for a potential change in trend. Get PRO Get access to exclusive premium features and benefits. Subscribe a PRO plan. See More Related Topics Trading Chart Patterns Using Volume for Trading Load More

Trading Trend Lines Read More »

Support and Resistance

Support and Resistance

Trading Support and Resistance Trading Series I Education Hub Prices are driven by two of humanity’s strongest emotions: Fear and Greed. When more investors are fearful that a stock will fall, it does! It will continue to decline until the balance between Fear and Greed is re-established. The same is true for greed and rising prices. This phenomenon is referred to as Market Psychology. Learning Tip Support and Resistance are zones of heavy volume generally. These are decision making levels, so they are quite crucial for price analysis. Understanding Support Level The diagram illustrates how market psychology causes the previous area of price support to turn into resistance. After breaking support, traders who bought in the zone of support are now holding losses and, in order to break even, want to sell as soon as prices approach their original purchase prices. Understanding Resistance Level The concept of resistance is opposite of the support as discussed above. Resistance is the price level where “fearful” sellers suddenly come into the market and prevent prices from advancing further. Like support, resistance can develop at a specific price or in a price zone and can be held for months at a time. If resistance is broken, market psychology causes the previous area of price resistance to turn into support. The diagram above illustrates this market behavior. Stockholders who sold in the zone of resistance are now regretting selling and want to buy as soon as prices approach the level they sold at earlier. Prices that seemed too high before now look like a bargain. Support and resistance share enough common characteristics to effectively be mirror images of each other. The same concept is true for positive divergences in downtrends. If volume begins to contract on new price lows but expands during rallies, prices may begin consolidating or reversing into an uptrend. Method How to Identify These Levels? High and Low Method: Support can be established with the previous reaction price lows, while resistance can be established by using the previous reaction price highs. Role Interchanging Method: Another principle of technical analysis stipulates that support can turn into resistance and vice versa. Once the price breaks below a support level, the broken support level can turn into resistance. The break of support signals that the forces of supply have overcome the forces of demand. Therefore, if the price returns to this level, there is likely to be an increase in supply, and hence resistance.  The other turn of the coin is resistance turning into support. As the price advances above resistance, it signals changes in supply and demand. The breakout above resistance proves that the forces of demand have overwhelmed the forces of supply; if the price returns to this level, there is likely to be an increase in demand and support will be found. Decision Zone Trading Range Trading ranges can play an important role in determining whether support and resistance function as turning points or continuation patterns. This signals that the forces of supply and demand are evenly balanced. When the price breaks out of the trading range, above or below, it signals that a winner has emerged.  A break above is a victory for the bulls (demand) and a break below is a victory for the bears (supply). Conclusion Important Points Identification of key support and resistance levels is an essential ingredient to successful technical analysis. Even though it is sometimes difficult to establish exact support and resistance levels, being aware of their existence and location can greatly enhance analysis and forecasting abilities. If a support or resistance level is broken, it signals that the relationship between supply and demand has changed. A resistance breakout signals that the bulls (demand) have gained the upper hand and a support break signals that the bears (supply) have won the battle. Get PRO Get access to exclusive premium features and benefits. Subscribe a PRO plan. See More Related Topics Trading Chart Patterns Using Volume for Trading Load More

Support and Resistance Read More »

Trading Candlesticks

Candlestick

Trading Trading Candlesticks Trading Series I Education Hub Compared to traditional OHLC bar charts, many traders consider candlestick charts more visually appealing and easier to interpret. Each candlestick provides an easy-to-decipher picture of price action. An analyst can quickly understand the relationship between the opening and closing price as well as the high and low price. Learning Tip Candlestick trading is one of the most popular chart trading. A good understanding of candlesticks will help you to understand stock price movement in a great and easy way. Understanding How to Use Candlesticks? Candlesticks with green bodies indicate buying pressure and red bodies indicate selling pressure. Long upper or lower shadows form when the market moves significantly in a particular direction during the day and then reverses before the end of the day. As a result, long lower shadows can infer bullishness while long upper shadows can infer a bearish market. If the closing price is higher than the opening price, the body will be displayed green. If the closing price is lower than the opening price, the body will be filled red with the following exception; if the closing price is higher than the previous day’s closing price, the body will then be filled green. Major Types Four Major Types of Candlesticks Market psychology is reflected in each of these candlestick formations in the following ways. Up Day, Higher Close: Typically results from expectations of higher prices (greed) out weighing expectations of lower prices (fear). The length of the candlestick body shown indicates especially strong buying. Down Day, Lower Close: Expectations of lower prices (fear) are stronger than those of higher prices (greed). As with the first candlestick, a longer candlestick body infers greater urgency of investors to sell their shares. Down Day, Higher Close: A rare candlestick, this one begins with an opening gap up in price from the previous day’s closing price but closes down for the day. In this case, heavy buying at the beginning of the day reversed but still closed higher than the previous day. This is a bearish sign when it occurs well into an upward price move. Up Day, Lower Close: Another rare candlestick, this one begins with an opening gap down in price from the previous day’s closing price but closes up for the day. This price action can be considered bullish during a downward price move since initial strong selling in the day becomes exhausted and buyers push the price higher at close. Get PRO Get access to exclusive premium features and benefits. Subscribe a PRO plan. See More Related Topics Trading Chart Patterns Using Volume for Trading Load More

Trading Candlesticks Read More »

Technical Analysis

Trading Technical Analysis Trading Series I Education Hub Technical analysis is the study of price and volume changes over time. Technical analysis usually involves the use of financial charts to help study these changes. Any person who analyzes financial charts can be called a Technical Analyst. Learning Tip Technical analysis helps a person to use technical indicators and make strategies for profitable trades. As said by world’s top market researchers over the years, there is not a single strategy that will always work. So, only after gaining massive experience and expertise you will be able to make good working strategies. Understanding How Stock Market Works? Despite being surrounded with data, charts, raw numbers, mathematical formulas, etc., technical analysts are really studying human behavior – specifically the behavior of crowds with respect to fear and greed. The emotional state of those investors is what determines the price for that stock. If more investors feel the stock will rise, it will! If more feel that the stock will fall, then fall it will. Thus, a stock’s price change over time is the most accurate record of the emotional state – the fear and the greed – of the market for that stock and thus, technical analysis is, at its core, a study of crowd behavior. Understanding Forecasting When was the last time you saw a 100% accurate weather forecast for your area? Chances are that at least some of the weather predictions your local weather person tells you won’t come to pass. In many cases, most of the predictions are wrong. So why do we keep listening to weather forecasts? Weather forecasts are useful because they help us prepare for what is likely. Technical analysis is very similar to weather forecasting. Good technical analysts know that technical analysis can prepare you for what is likely to happen but, just like many weather forecasts, things can change in unpredictable ways.  Working Process How Technical Analysis Works? The reason technical analysis has value is that directional price moves are often sustained for a period of time allowing analysts to detect and profit from the change in price. Even though a technical analyst has many math-based tools to analyze price and volume movement, the process is ultimately an art in the study of human behavior. Just as the meteorologist can never guarantee a weather forecast, a technical analyst can never be perfectly certain of future price movements since human behavior is involved. All investors are faced with three basic questions with their investments. What to invest in, when to buy and when to sell. Technical analysis provides a framework for investors to methodically select equities and pick times to buy and sell. Technical analysts always know how much risk they are taking and know when to “get out while the getting is good”. In order words, if prices are in an uptrend prior to a rectangle pattern forming, prices will usually resume the uptrend once the rectangle pattern finishes. Basically, consolidation patterns are places where the bulls and the bears have another short-term argument about the stock, but it is a half-hearted one. The bigger picture doesn’t really change. The Backbone Use of Price and Volume The underlying premise of technical analysis is that all known information such as its financial results, analyst’s ratings, management performance, news, etc. are reflected in the historical price and volume data. This is a powerful concept since it is impossible to gauge how these factors may influence future price separately. It is important to understand that technical analysis can only be used to determine the likely direction of future prices. It cannot anticipate news events or how investors will respond to them. The Psychology Why Technical Analysis Works? Technical analysis works because price and volume often reveal the collective psychology (the “fear/greed balance”) of a market’s participants. Technical charts can reveal changes in the fear/greed balance soon after those changes occur and that provides opportunities for profitable trades.Technical analysts work to identify charts where the fear/greed balance has recently changed in a predictable manner.  They then place trades to try and profit from that change. Once they have bought a stock, technical analysts monitor price and volume for sell signals.Done correctly, trades based on technical analysis carry a higher-than-average chance of success; however, disciplined money management techniques must still be used to guard against unforeseen price movements. Get PRO Get access to exclusive premium features and benefits. Subscribe a PRO plan. See More Related Topics Trading Chart Patterns Using Volume for Trading Load More

Technical Analysis Read More »