Support and Resistance
Trading Series I Education Hub
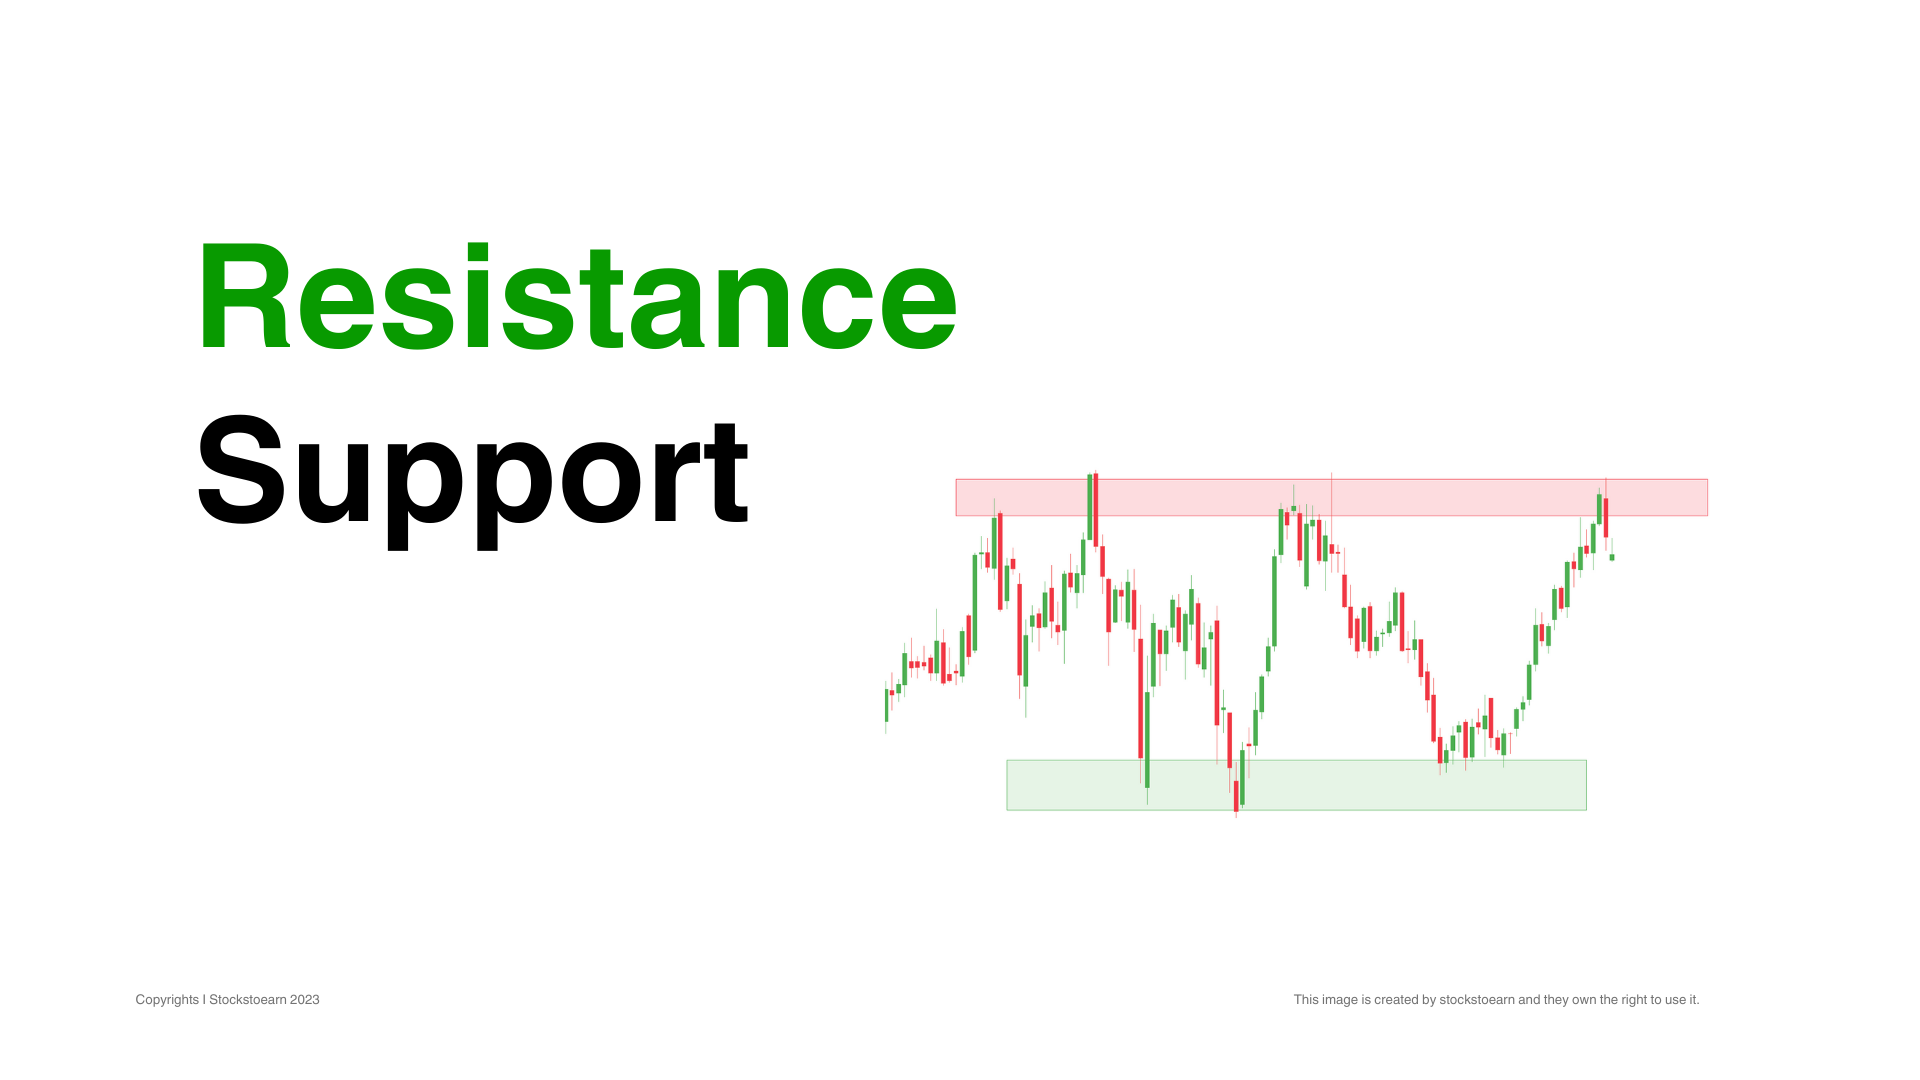
Prices are driven by two of humanity’s strongest emotions: Fear and Greed. When more investors are fearful that a stock will fall, it does! It will continue to decline until the balance between Fear and Greed is re-established. The same is true for greed and rising prices. This phenomenon is referred to as Market Psychology.
Learning Tip
Support and Resistance are zones of heavy volume generally. These are decision making levels, so they are quite crucial for price analysis.
Understanding
Support Level
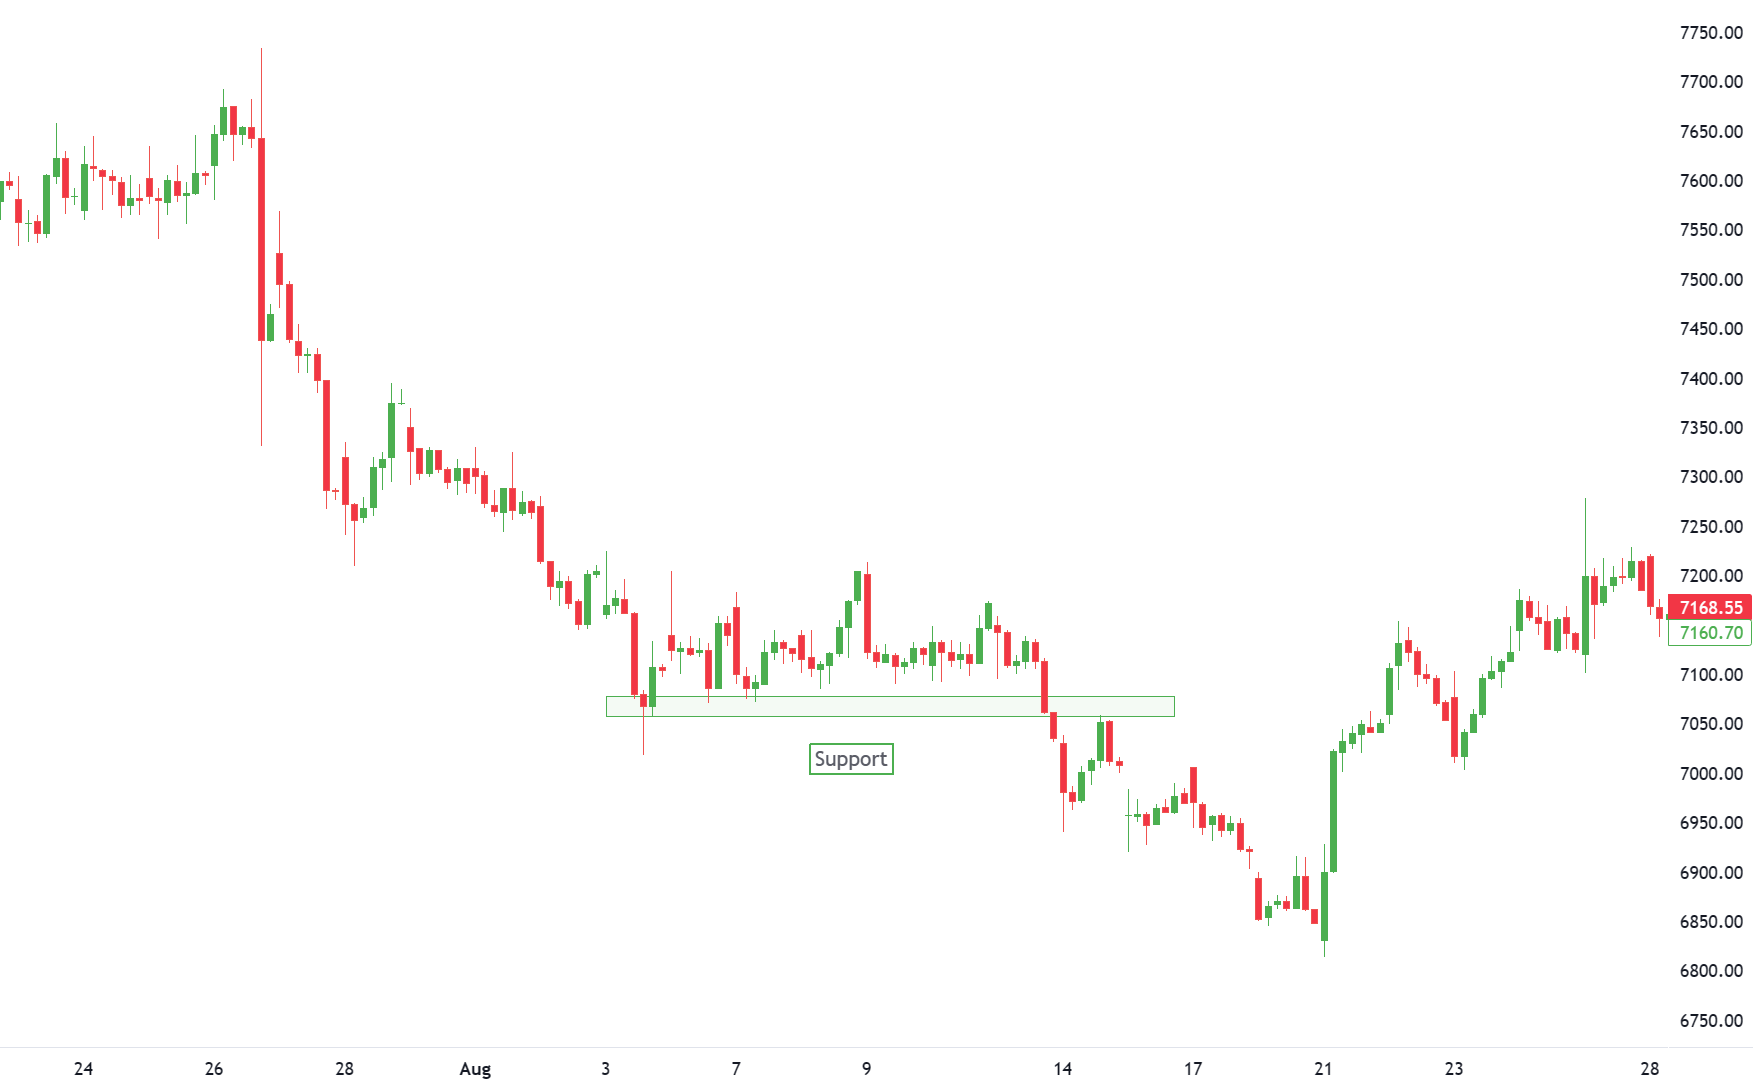
The diagram illustrates how market psychology causes the previous area of price support to turn into resistance. After breaking support, traders who bought in the zone of support are now holding losses and, in order to break even, want to sell as soon as prices approach their original purchase prices.
Understanding
Resistance Level
The concept of resistance is opposite of the support as discussed above. Resistance is the price level where “fearful” sellers suddenly come into the market and prevent prices from advancing further. Like support, resistance can develop at a specific price or in a price zone and can be held for months at a time.
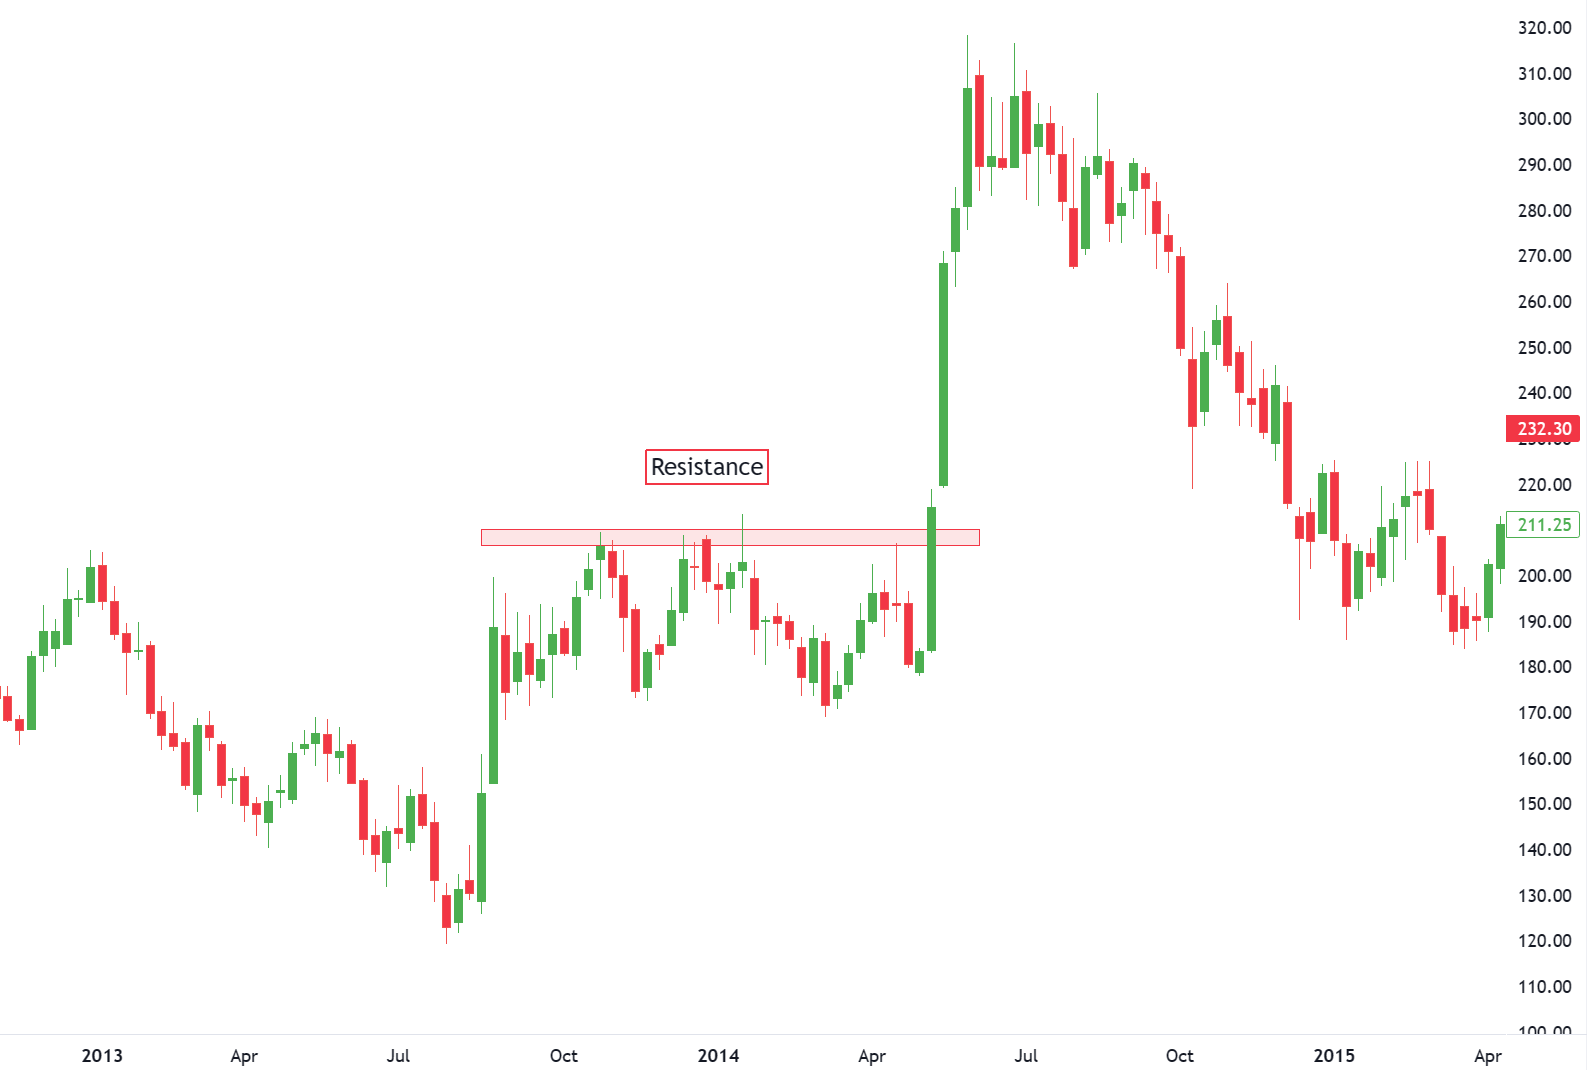
If resistance is broken, market psychology causes the previous area of price resistance to turn into support. The diagram above illustrates this market behavior. Stockholders who sold in the zone of resistance are now regretting selling and want to buy as soon as prices approach the level they sold at earlier. Prices that seemed too high before now look like a bargain.
Support and resistance share enough common characteristics to effectively be mirror images of each other.
The same concept is true for positive divergences in downtrends. If volume begins to contract on new price lows but expands during rallies, prices may begin consolidating or reversing into an uptrend.
Method
How to Identify These Levels?
High and Low Method: Support can be established with the previous reaction price lows, while resistance can be established by using the previous reaction price highs.
Role Interchanging Method: Another principle of technical analysis stipulates that support can turn into resistance and vice versa. Once the price breaks below a support level, the broken support level can turn into resistance. The break of support signals that the forces of supply have overcome the forces of demand.
Therefore, if the price returns to this level, there is likely to be an increase in supply, and hence resistance.
The other turn of the coin is resistance turning into support. As the price advances above resistance, it signals changes in supply and demand. The breakout above resistance proves that the forces of demand have overwhelmed the forces of supply; if the price returns to this level, there is likely to be an increase in demand and support will be found.
Decision Zone
Trading Range
Trading ranges can play an important role in determining whether support and resistance function as turning points or continuation patterns. This signals that the forces of supply and demand are evenly balanced. When the price breaks out of the trading range, above or below, it signals that a winner has emerged.
A break above is a victory for the bulls (demand) and a break below is a victory for the bears (supply).
Conclusion
Important Points
Identification of key support and resistance levels is an essential ingredient to successful technical analysis. Even though it is sometimes difficult to establish exact support and resistance levels, being aware of their existence and location can greatly enhance analysis and forecasting abilities.
If a support or resistance level is broken, it signals that the relationship between supply and demand has changed. A resistance breakout signals that the bulls (demand) have gained the upper hand and a support break signals that the bears (supply) have won the battle.
Get PRO
Get access to exclusive premium features and benefits. Subscribe a PRO plan.
